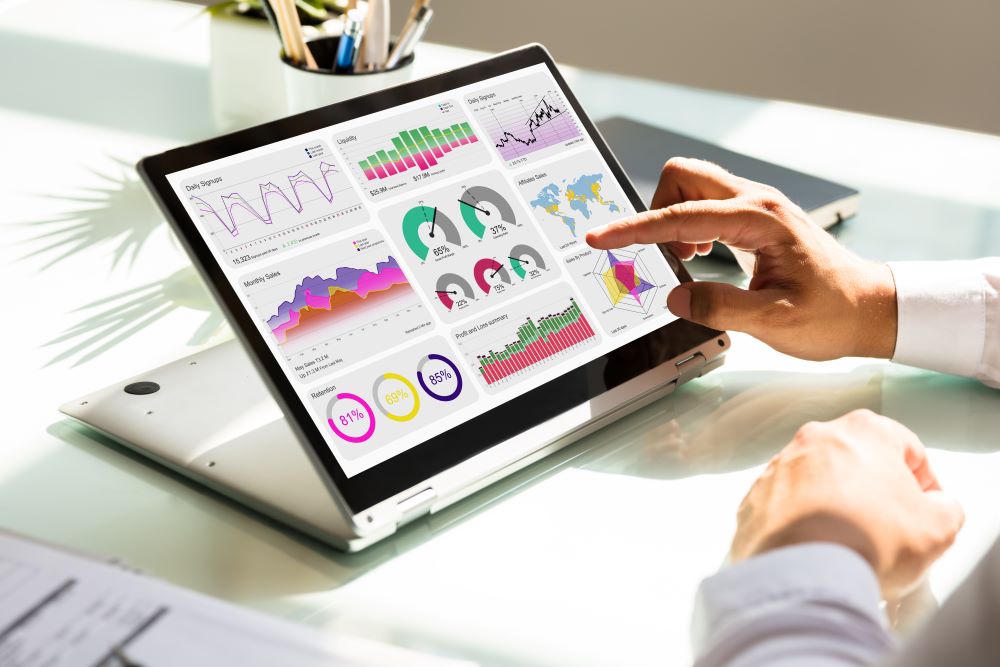
Data dashboards are interfaces which display complex data to a user, often displayed in real time, and drawn from many sources. The dramatic increase in the volume and nature of data being produced has created new possibilities to understand trends, spot patterns, and collect intelligence.
They bring varying types and quantities of data into a single user-friendly interface for visual representation, and they are the visible face of this revolution. You can use a dashboard to monitor the overall health of your business, department, or a specific process.
Dashboards are customisable, you can build a dashboard that supports the specific needs of your users.
Data dashboards can be used by any business, the dashboard can be used to define metrics, set performance goals, and identify problems without having to sift through pages and pages of reports. With the wide range of abilities, digital dashboards will adapt to fit your needs and be customised to your business functions.
Dashboards allow users to manipulate and interact with data dynamically, whereas reports show a static picture of the existing data. Generally, dashboards are optimal for everyday analytics and BI needs, while reports are useful to capture static data. Dashboards are unique in their dynamic and interactive abilities, as well as their timely updates. Reports provide a clearer high-level view of the cost of live data. In the end, they’re both useful tools when necessary.
A data dashboard gives businesses a single application for connecting to, interacting with, and visualising any data, from various sources on any device. It requires little effort to install and manage, can be accessed from any location remotely and enables efficient overview of your business.
Date: October 18, 2021
Author: Magnetar IT